NOAA has a long and respected history for impartial and reliable science, seving both the US Government and marine based industry with weather and climate research and modeling. NOAA is an excellent resource for raw data concerning climate trend in North America. I will present several NOAA graphs here which provide a good general picture of the trend of key climate parameters, underlying change already underway.
 />[source : http://www.climatewatch.noaa.gov/2009/articles/climate-change-global-temperature ]
The next chart we should look at infers the most probable cause of this warming trend - rapidly building levels of atmospheric gases which are scientifically proven to cause "greenhouse" warming effects when they accumulate to sufficient volume. The ability of these gases to cause a warming event are solid concluded science, there is no scientific debate on this. The debate concerns how much of an effect, how rapid the effect builds, and how quickly it can be turned around.

This graph indicates a clear and sustained increase in atmospheric carbon dioxide in the analysis period of 1958 to 2008. The warming effect of CO2 is proven settled science.
CO2 is a global heating gas (GHG). When you increase levels of GHGs you increase the heat of a planet. Since the beginning of the 20th Century, global CO2 levels have increased 25%. For further information on the proven science behind greenhouse effect and CO2, please take a look at this article :
[article : A Hyperlinked History of Climate Change Science ]
The Greenhouse Effect :
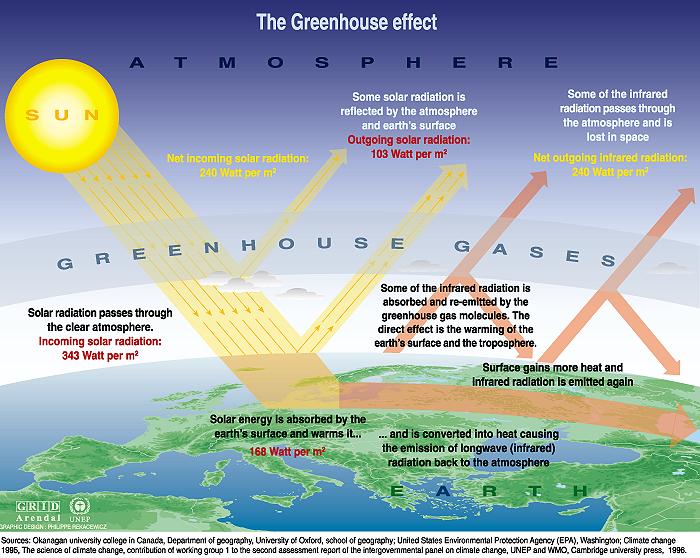
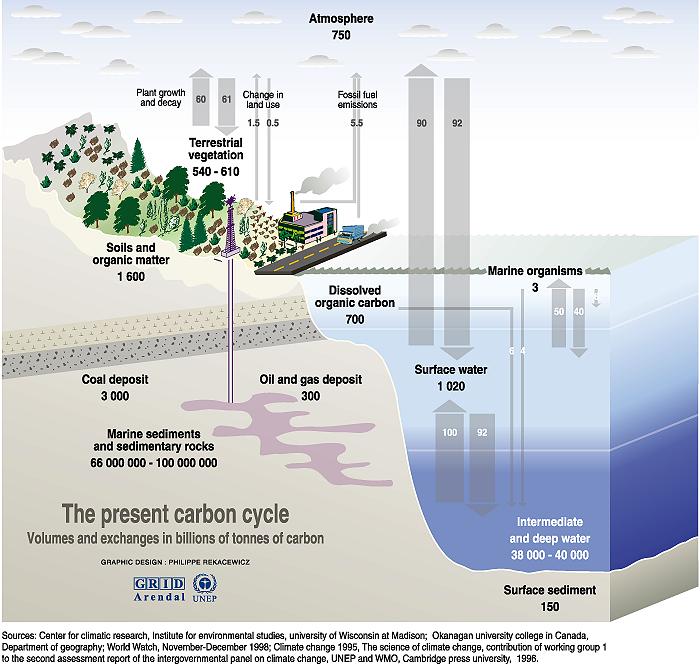
This substantial increase in CO2 levels in the atmosphere can be traced back to several changes in human behavior in the 19th and 20th centuries, namely deforestation (cutting down trees which naturally absorb CO2 and produce Oxygen) and the increasing rates at which we are mining and burning fossi fuels (coal, gas, oil). The following illustration summarizes the breakdown of CO2 increases by source and their impact.
[source : http://unfccc.int/essential_background/feeling_the_heat/items/2903.php ]
In addition to warming the atmosphere, increased CO2 levels are also absorbed into the world's oceans. High levels of CO2 absorption will eventually cause the acidity of the oceans to increase. Critical elements of the ocean sea chain including plankton and shellfish are highly impacted by the pH of the water, increases in acidity would significantly reduce the levels of plankton and shellfish in the oceans, reducing food supplies for significant portions of the marine food chain. More troubling still, plankton are one of the largest producers of atmospheric oxygen in the world. Indeed, the original source of atmospheric oxygen in the early years of the evolution of life on Earth was indeed from early plankton organisms.
Please refer to the following article (PDF) by the NOAA on ocean acidification :
[article : Carbon Dioxide and Our Ocean Legacy ]
Ocean Acidification: Anthropogenic, Carbon dioxide, Earth's atmosphere, PH, Biological pump, Carbon sink, Carbonate compensation depth, Continental shelf ... Ocean Data Analysis Project, Solubility pump
Finally, lets take a look at global sea level trends. Warming of the atmosphere, the oceans and the surface of the planet is resulting in the release of ice from glaciers, the arctic pack, antartica and the melting of snows that usually remain in place year round. All of this melted ice and snow flows as water back into the oceans resulting in more water volume. Just as adding water to a bath tub increases its level, adding large volumes of water to the oceans has the same effect. The following graph represents sea level readings at New York from 1920 to 2009, based on readings from the same tide gauge station.

Again we have a very clear upward trend in sea levels. Its notable that warming has accelerated in this same window and acceleration is expected to increase rate further as warming begins to release other greenhouse gases (most notably, methane trapped in frozen soils in Siberia, Scandinavia and northern Canadian territories. Methane is a far more dangerous gas than CO2 in terms of warming effect).
Rising sea levels present a significant risk of flooding for millions of people around the globe. The current predicted sea level change assuming moderate to little reduction in CO2 pollution would result in the permanent flooding of lands currently occupied by millions :
To sum up, the NOAA is on the record with hard imperical data confirming warming, confirming rising CO2 levels are the prime source, confirming human activity is the primary factor in the release of this CO2, and confirming sea level increases are on a dangerous trajectory. A quote from nature sums up where we are quite succinctly :

However, before we get to the charts, I must make an important point on how scientific charts should be interpreted. There has been much deliberate confusion of the public recently by climate deniers claiming that over a certain period, warming has stop, or even, reversed. This conclusion is reached by cheating the data. Take any one point in a bar chart for example and compare to another. If you cherry pick the two dates to arrive at a particular conclusion, you can try to pick, for example, an unusually hot year 10 or 20 years ago, and compare to a normal recent year. This trick gives the illusion that warming is not occurring and is deliberately used to cause confusion in the public, reducing interest in regulating emissions and tackling climate change.
As with any long term data, these charts should be viewed by looking at the general average trend over many years. When looked at in this manner, the data is very strongely in favor of the conclusions climate scientists have reached - we are approaching a very dangerous climate event.
/>This chart depicts the trend in global average temperates from 1880 to 2009. These temperature readings are an average of all global temperates for each year, readings taken from all over the globe. In this time period although individual spikes and dips show short term variability, the trend is crystal clear, a notable acceleration in total world average temperate since the early 1970s. We are at least forty years into this trend, if you ignore the beginning warming in the 1930s and 1940s.
This is not a model, these are real measured temperatures from weather readings around the world, averaged to an average yearly temp and then plotted for this timeline. The trend is significant.
The next chart we should look at infers the most probable cause of this warming trend - rapidly building levels of atmospheric gases which are scientifically proven to cause "greenhouse" warming effects when they accumulate to sufficient volume. The ability of these gases to cause a warming event are solid concluded science, there is no scientific debate on this. The debate concerns how much of an effect, how rapid the effect builds, and how quickly it can be turned around.
For the last 50 years, global temperatures rose at an average rate of about
0.13c (around one quarter degree Fahrenheit) per decade - almost twice as fast
as the 0.07c per decade increase observed over the previous half-century.
In the next 20 years, scientists project that global average temperature will
rise by around 0.2c (about one-third of a degree Fahrenheit) per
decade.
The most abundant greenhouse gas (but not the most dangerous per part per million) is of course Carbon Dioxide (CO2). Carbon Dioxide is produced by living organisms, both animal and plant, through geophysical processes, and human activity such as buring fossil fuels. The Earth has a natural baseline balance, a natural level of CO2, Nitrogen and Oxygen levels which have been relatively stable prior to the 20th Century for the entire time period in which human civilization has been present. Large scale change in the make up of our atmosphere (approx 4 miles thick before you reach space) would have a significant impact on the long term balance of life on this planet. Already, we have seen long drought periods in various areas of the planet including the American southwest, Australia and the African continent. These drought areas are growing and already diminishing the available farmland for our food needs (both cattle and produce farming).
This graph indicates a clear and sustained increase in atmospheric carbon dioxide in the analysis period of 1958 to 2008. The warming effect of CO2 is proven settled science.
The vast majority of climate scientists are concerned that the dramatic rise in carbon dioxide is causing the planet to warm. Likely consequences of global warming include sea level rise, shifting precipitation patterns, expansion of areas affected by drought, increasing numbers of severe heat waves, and more intense precipitation events.
Scientists are also concerned that carbon dioxide absorbed by the ocean from the atmosphere is increasing the acidity of seawater. This change in ocean chemistry interferes with the ability of marine plants and animals to build their shells, ultimately threatening a reorganization of the entire marine food chain, which could lead to a mass extinction event.
CO2 is a global heating gas (GHG). When you increase levels of GHGs you increase the heat of a planet. Since the beginning of the 20th Century, global CO2 levels have increased 25%. For further information on the proven science behind greenhouse effect and CO2, please take a look at this article :
[article : A Hyperlinked History of Climate Change Science ]
The Greenhouse Effect :
This substantial increase in CO2 levels in the atmosphere can be traced back to several changes in human behavior in the 19th and 20th centuries, namely deforestation (cutting down trees which naturally absorb CO2 and produce Oxygen) and the increasing rates at which we are mining and burning fossi fuels (coal, gas, oil). The following illustration summarizes the breakdown of CO2 increases by source and their impact.
[source : http://unfccc.int/essential_background/feeling_the_heat/items/2903.php ]
In addition to warming the atmosphere, increased CO2 levels are also absorbed into the world's oceans. High levels of CO2 absorption will eventually cause the acidity of the oceans to increase. Critical elements of the ocean sea chain including plankton and shellfish are highly impacted by the pH of the water, increases in acidity would significantly reduce the levels of plankton and shellfish in the oceans, reducing food supplies for significant portions of the marine food chain. More troubling still, plankton are one of the largest producers of atmospheric oxygen in the world. Indeed, the original source of atmospheric oxygen in the early years of the evolution of life on Earth was indeed from early plankton organisms.
Please refer to the following article (PDF) by the NOAA on ocean acidification :
[article : Carbon Dioxide and Our Ocean Legacy ]
Ocean Acidification: Anthropogenic, Carbon dioxide, Earth's atmosphere, PH, Biological pump, Carbon sink, Carbonate compensation depth, Continental shelf ... Ocean Data Analysis Project, Solubility pump
Finally, lets take a look at global sea level trends. Warming of the atmosphere, the oceans and the surface of the planet is resulting in the release of ice from glaciers, the arctic pack, antartica and the melting of snows that usually remain in place year round. All of this melted ice and snow flows as water back into the oceans resulting in more water volume. Just as adding water to a bath tub increases its level, adding large volumes of water to the oceans has the same effect. The following graph represents sea level readings at New York from 1920 to 2009, based on readings from the same tide gauge station.
Again we have a very clear upward trend in sea levels. Its notable that warming has accelerated in this same window and acceleration is expected to increase rate further as warming begins to release other greenhouse gases (most notably, methane trapped in frozen soils in Siberia, Scandinavia and northern Canadian territories. Methane is a far more dangerous gas than CO2 in terms of warming effect).
Rising sea levels present a significant risk of flooding for millions of people around the globe. The current predicted sea level change assuming moderate to little reduction in CO2 pollution would result in the permanent flooding of lands currently occupied by millions :
A recent Nature study suggested that Greenland's ice sheet will begin to melt if the temperature there rises by 3 degrees Celsius (5.4 degrees Fahrenheit). That is something many scientists think is likely to happen in another hundred years. The complete melting of Greenland would raise sea levels by 7 meters (23 feet). But even a partial melting would cause a one-meter (three-foot) rise. Such a rise would have a devastating impact on low-lying island countries, such as the Indian Ocean's Maldives, which would be entirely submerged.[source : http://news.nationalgeographic.com/news/2004/04/0420_040420_earthday_2.html ]
Densely populated areas like the Nile Delta and parts of Bangladesh would become uninhabitable, potentially driving hundreds of millions of people from their land. A one-meter sea level rise would wreak particular havoc on the Gulf Coast and eastern seaboard of the United States. "No one will be free from this," said Overpeck, whose maps show that every U.S. East Coast city from Boston to Miami would be swamped. A one-meter sea rise in New Orleans, Overpeck said, would mean "no more Mardi Gras."
To sum up, the NOAA is on the record with hard imperical data confirming warming, confirming rising CO2 levels are the prime source, confirming human activity is the primary factor in the release of this CO2, and confirming sea level increases are on a dangerous trajectory. A quote from nature sums up where we are quite succinctly :
"Is society aware of the seriousness of climate warning? I don't think so," said Marianne Douglas, a geology professor at the University of Toronto. "If we were, we'd all be leading our lives differently. We'd see a society that embraced alternative sources of energy, with less dependency on fossil fuels." Overpeck says passing on the problem of global warming to future generations is like ignoring a government budget deficit. "Except with the deficit, there are economic mechanisms that could be put in place to get out of the large deficit," he said. "With sea level rise, there's really no technological way to put the ice back on Greenland."


No comments:
Post a Comment
Please also join our facebook group at http://www.facebook.com/?ref=home#!/group.php?gid=111271878911510 to meet with other readers of this blog interested in climate change.